Inspect Element is a developer tool that allows you to view and temporarily modify the HTML, CSS, and JavaScript of a webpage. It’s an essential feature for web developers, designers, and even curious users who want to understand how websites are built or make quick visual changes. This comprehensive guide will walk you through the process how to use Inspect Element on a Mac to modify webpages.
Key benefits of using Inspect Element include:
- Debugging website issues
- Testing design changes without affecting the actual website
- Learning web development techniques by examining other sites
- Improving website accessibility
- Optimizing website performance
Accessing Inspect Element on Different Mac Browsers
Safari
Safari, being the default browser on Mac, requires a few extra steps to enable the Inspect Element feature:
- Open Safari and go to Safari > Settings (or Preferences in older versions).
- Click on the “Advanced” tab.
- Check the box next to “Show Develop menu in menu bar”.
Once enabled, you can access Inspect Element in Safari by:
- Right-clicking on any element and selecting “Inspect Element”
- Using the keyboard shortcut Command + Option + I
- Clicking on Develop > Show Web Inspector in the menu bar
Google Chrome
Chrome’s Developer Tools are more readily accessible:
- Right-click on any element and select “Inspect”
- Use the keyboard shortcut Command + Option + I
- Click on View > Developer > Developer Tools in the menu bar
Mozilla Firefox
Firefox offers similar ease of access:
- Right-click on any element and select “Inspect Element”
- Use the keyboard shortcut Command + Option + I
- Click on Tools > Web Developer > Inspector in the menu bar
Basic Use Inspect Element
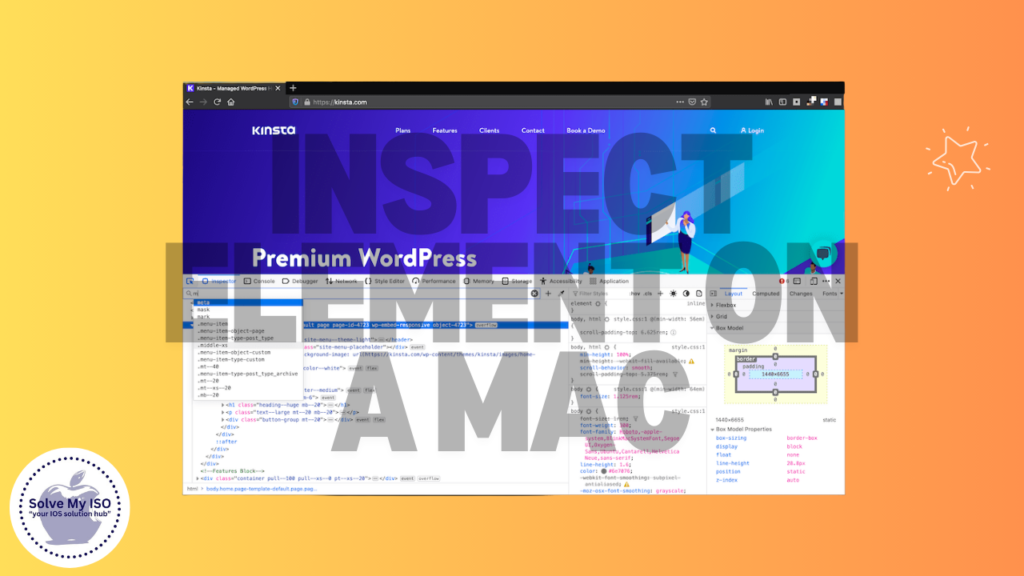
Once you’ve opened the Inspect Element tool, you’ll see a split-screen view with the webpage on one side and the developer tools on the other. Here’s how to use it:
- Selecting Elements:
- Click on the element selector tool (usually an icon with a cursor over a box) in the developer tools panel.
- Hover over elements on the page to highlight them.
- Click on an element to select it and view its code in the developer tools panel.
- Viewing HTML:
- The HTML structure of the selected element will be displayed in the “Elements” tab.
- You can expand and collapse nested elements to explore the page structure.
- Modifying HTML:
- Double-click on the HTML in the Elements tab to edit it.
- Press Enter to apply changes and see them reflected on the page immediately.
- Viewing CSS:
- Select an element and look for the “Styles” panel in the developer tools.
- This shows all CSS rules applied to the selected element.
- Modifying CSS:
- Click on any CSS property or value to edit it.
- Add new properties by clicking on a blank line in the Styles panel.
- Toggle CSS properties on and off using the checkbox next to each rule.
- Using the Console:
- Switch to the “Console” tab to run JavaScript commands or view errors.
- Type JavaScript directly into the console to interact with the page.
Remember, all changes made using Inspect Element are temporary and will be lost when you refresh the page.
Advanced Techniques
For more experienced users, here are some advanced techniques:
- Force Element State:
- In the Styles panel, you can force elements into states like :hover, :active, or :focus to style and debug these states.
- Emulate Mobile Devices:
- Use the device emulation feature (available in Chrome and Firefox) to test responsive designs.
- In Chrome, click the “Toggle device toolbar” icon or use the keyboard shortcut Command + Shift + M.
- Analyze Network Requests:
- Use the “Network” tab to monitor all network requests made by the page.
- Identify performance bottlenecks and optimize load times.
- Debug JavaScript:
- Set breakpoints in your JavaScript code using the “Sources” tab.
- Step through code execution to identify and fix bugs.
- Audit Accessibility:
- Use built-in accessibility auditors (available in Chrome and Firefox) to check for common accessibility issues.
- Capture Screenshots:
- Take full-page or element-specific screenshots directly from the developer tools.
- In Chrome, use the Command + Shift + P shortcut and type “screenshot” to access various screenshot options.
Common Use Cases
- Debugging Layout Issues:
- Inspect elements to identify misaligned or improperly styled components.
- Modify CSS properties in real-time to test fixes.
- Content Editing:
- Temporarily change text content to see how different copy fits within the design.
- Useful for creating mockups or presentations.
- Responsive Design Testing:
- Use device emulation to test how your site looks on various screen sizes.
- Modify CSS media queries to fine-tune responsive breakpoints.
- Performance Optimization:
- Analyze network requests to identify slow-loading resources.
- Use the Performance tab (in Chrome) to profile JavaScript execution and identify bottlenecks.
- Learning from Other Websites:
- Inspect well-designed websites to understand their HTML structure and CSS techniques.
- Analyze how complex UI components are built.
Risks and Limitations
While Inspect Element is a powerful tool, it’s important to be aware of its limitations:
- Temporary Changes: All modifications made through Inspect Element are temporary and will be lost upon page refresh.
- Client-Side Only: You can only modify what’s visible in the browser. Server-side code and databases cannot be accessed or modified.
- Security Measures: Some websites implement measures to prevent inspection or modification of certain elements.
- Potential Breakage: Modifying critical elements or scripts may cause the webpage to malfunction.
- Legal and Ethical Considerations: Always respect website terms of service and copyright. Don’t use Inspect Element for malicious purposes.
Troubleshooting
If you encounter issues while using Inspect Element, try these troubleshooting steps:
- Inspect Element Not Working:
- Ensure that developer tools are enabled in your browser settings.
- Try restarting your browser or clearing the cache.
- Changes Not Reflecting:
- Check if the website has any script that’s reverting your changes.
- Ensure you’re modifying the correct element (use the element selector tool to confirm).
- Developer Tools Freezing:
- Close and reopen the developer tools.
- If persistent, try disabling browser extensions or restarting your Mac.
- Can’t Select Specific Elements:
- Some elements might be generated dynamically. Try inspecting parent elements and navigating through the HTML structure.
Additional Resources
To further enhance your skills with Inspect Element and web development on Mac, consider these resources:
- Apple’s Official Safari Developer Documentation
- Google Chrome DevTools Documentation
- Mozilla Firefox Developer Tools Documentation
- Solvemyios – For additional Mac and iOS troubleshooting guides
Remember, mastering Inspect Element takes practice. Don’t be afraid to experiment with different websites and explore all the features your browser’s developer tools have to offer. Happy inspecting!